How St. Tammany School Pay Compares—and What the Averages Leave Out
A look at teachers, paraprofessionals, bus drivers and other school employees...

Why Competitive Pay is One of My Top Priorities
Safe, well-funded schools must continuously strive for excellence, and it's the individuals involved who make that happen. To attract and retain qualified and dedicated professionals, including paraprofessionals, bus drivers, custodians, cafeteria staff, and more, we must provide competitive salaries that recognize their expertise, commitment, and service.
Before the first bell rings, a bus driver has already started the day, a cafeteria worker is preparing breakfast, and a teacher is getting ready for a room full of students. Their work keeps St. Tammany’s schools running. But when they sit down to pay their own bills, the district’s “average salary” means very little. What matters is their paycheck, how far it stretches, and whether years of service bring dependable progress. So I wanted to know:
Are we paying our school employees well enough to build a career here—and are we making the best use of taxpayers’ money to do it?
As a candidate for School Board, my answer is no.
I believe we are not making the best use of the money taxpayers already provide, and our pay policies do not do enough to make a lasting career in our schools financially workable. We should put greater priority on the people who teach our children, help them learn, feed them and get them home safely. That means examining spending choices and making dependable employee pay a priority in the budget.
To make the point, I reviewed the district's current vacancy list that shows there are positions to fill right now. My count of the district’s September 25, 2026 teacher-vacancy shows 21 openings, including 14 marked for special education. The list includes a speech-pathologist position and two future start dates; it does not show how classes or services are currently covered or why each opening exists. This is in stark contrast to several decades ago when job openings in St. Tammany were unheard of. Although this snapshot alone cannot tell us whether recruitment is getting harder, the question that needs to be answered is...why are we having a hard time hiring and keeping qualified teachers and employees? Source: district vacancy list.
While vacancies provide an anecdotal source for speculation, data-driven studies certainly lend scientific support to the correlation between better pay and retention of employees. A 2022 Louisiana Legislative Auditor study found that each additional $1,000 in teacher salary was associated with a 0.4-percentage-point greater likelihood of remaining in Louisiana’s public education workforce. While that statewide finding supports taking compensation seriously; it does not establish if or how many St. Tammany employees left because of subpar pay. And if our Human Resources department isn't already asking those leaving these types of questions, they certainly should be...but that's a topic for a different article. My position is that we should make staying here—and choosing to work here—a stronger financial proposition, while requiring a clear accounting of how we use every available dollar. Source: Legislative Auditor, pages 16–17.
For all of these reasons, pay deserves a serious place in any discussion about the future of this school district.
How St. Tammany School Pay Compares—and What the Averages Leave Out
St. Tammany collected $331.6 million in school property and sales taxes in 2024–25—the fourth-highest total among Louisiana parish school boards. But its average classroom teacher salary was $62,195, which ranked 20th among the 69 city and parish school systems in the state’s comparison. School financial reports · Teacher salary report
Those numbers only tell part of the story. But they don’t necessarily tell taxpayers or district employees - whether that's a new teacher, classroom aide or bus driver - what that translates to on payday.
To understand how St. Tammany’s pay compares with other districts, we need to compare people doing similar jobs, with similar experience and qualifications. We also need to check how many days they work each year and whether the pay includes extra compensation beyond their regular salary.
A quick note about the dates: The teacher averages and school finances here are from 2024–25. The support-staff examples use 2025–26 salary schedules. These figures show what pay looked like in those years; they are not the current 2026–27 rates. They also do not include the value of retirement or health benefits.
1. Teachers: the district average can hide a bigger pay gap for newer teachers
An average combines the pay of teachers just starting out with the pay of those who have worked for decades. It also includes teachers with different degrees. That makes it useful for a broad comparison, but less useful for someone asking, “What would I earn?”
Before we compare those numbers, there’s another detail that matters when it comes to average pay for St. Tammany teachers: they do not automatically move up the salary schedule every year.
A salary schedule lists pay at different levels, often called “steps.” It may look like an employee moves up one step with each year of experience, but in St. Tammany, that move depends on the School Board’s pay decisions, available funding and the rules for who qualifies. So the pay scale is more of what the School Board intends to do rather than an actual reflection of what it actually does. Also, sometimes the decision to pay or not pay is applied unevenly. There have been instances where administrators got a pay increase while rank and file employees did not (that's a story for another time).
A teacher looking at the district’s salary schedule might reasonably expect to move up to the next pay level after another year in the classroom. But in St. Tammany, gaining another year of experience and moving up the pay schedule do not always go together.
The district’s own history helps explain why. In 2017, a pay agreement ended what the Louisiana Federation of Teachers described as a four-year freeze on movement through the salary schedule. During that freeze, employees continued gaining experience without advancing through the schedule. The agreement restored two steps that year and provided teacher pay increases in the following two years. The School Board approved the agreement and the new salary schedule that June. Union report · School Board minutes
More recently, the board approved a move up one pay level for 2024–25. The following year, it took a different approach: teachers received a separate $2,550 raise, with the amount adjusted for those working longer school-year calendars, but did not receive the regular move to the next pay level. Teachers still received a raise that year; it simply came through a different change to their pay. 2024–25 pay increases · 2025–26 salary policy, printed page 21
That distinction matters when someone is trying to plan a career or a household budget. A higher salary listed farther down the schedule does not, by itself, tell an employee when they will reach it. Their experience keeps growing, but their movement through the pay levels depends on the board’s decisions. That is why the district cautions that a teacher’s pay level may not match their years of experience—and why our comparisons use reported years of experience whenever possible.
That’s why the comparisons below use teachers’ reported years of experience wherever that information is available. In the support-staff tables, we call pay levels “levels,” because they may not match years worked.
The next table compares teacher pay across the region. One column shows each district’s overall average. The other three compare teachers who have a bachelor’s degree and the same reported years of experience. All four columns include reported extra compensation, so they should not be read as base salary alone.
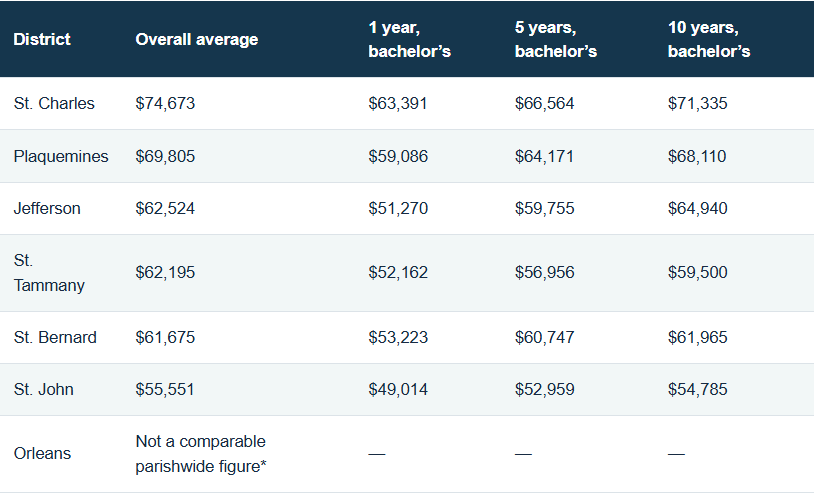
At first glance, teacher pay in Jefferson and St. Tammany looked almost identical. Jefferson’s overall average was just $330 higher. But that districtwide average doesn’t tell us how teachers at the same point in their careers compared.
For teachers with a bachelor’s degree and ten years of experience, the gap was much wider. Jefferson’s reported average was $5,440 higher than St. Tammany’s. In St. Charles, teachers at that same experience and degree level averaged $11,835 more than their St. Tammany counterparts.
The Jefferson numbers need a closer look, though, because those totals include extra compensation beyond regular salary. Take that extra compensation out, and the comparison reverses: St. Tammany averaged $58,494, while Jefferson averaged $56,367. That put St. Tammany ahead by $2,127 before the extras were counted.
I'm spelling out that difference to give readers the full picture of Jefferson’s numbers. But regular salary is only part of what an employee earns, and extra compensation still counts toward the total. When all reported compensation was included, Jefferson teachers with a bachelor’s degree and ten years of experience earned an average of $5,440 more than their St. Tammany counterparts in 2024–25. That does not guarantee every teacher would earn more in Jefferson, but it is a meaningful difference in what those employees earned that year.
The five highest parish teacher-pay averages statewide
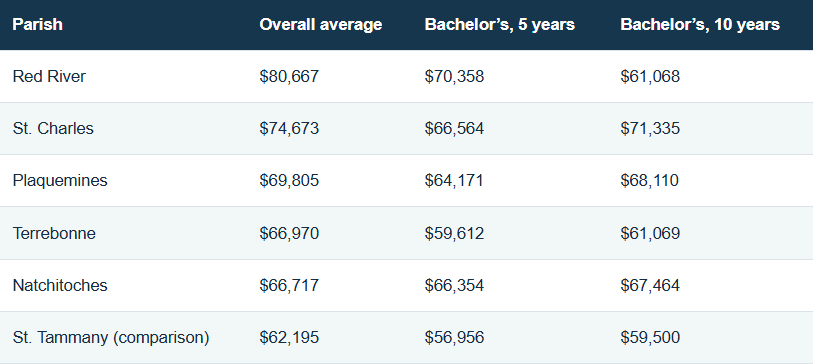
What does the district’s average salary mean for a teacher nine years into the job?
I wanted to see how that average compared with what teachers earned at the same point in their careers. So I looked at teachers with a bachelor’s degree and nine years of experience in Jefferson, St. Bernard and St. Tammany.
In Jefferson, that group averaged $65,626, more than the district’s overall teacher average of $62,524. In St. Bernard, the nine-year group averaged $63,242, also above its district average of $61,675.
In St. Tammany, the picture was different. Teachers with the same degree and experience averaged $59,180—about $3,000 below the district’s overall average of $62,195. St. Tammany’s group with twelve years of experience averaged $62,230, just above that districtwide figure.
I’m making this comparison because the School Board and district leadership often point to average teacher pay. But if you’re a teacher looking at that number, the natural question is, “How long will it take me to earn that much?” In these figures, teachers with a bachelor’s degree and nine years of experience in Jefferson and St. Bernard were already earning more, on average, than their district’s overall average. In St. Tammany, the nine-year group was still about $3,000 below our average pay, while the twelve-year group was just above it. That doesn’t give every teacher an exact timetable, but it shows why I want to look beyond the average and ask where teachers actually stand after years in our classrooms.
There’s a limit to what this comparison tells us, though. These figures show what different groups of teachers earned in 2024–25, including reported extra compensation. They don’t follow the same teachers from year to year, so I can’t definitively say a St. Tammany teacher will reach the district average in year twelve. Nor do they show that St. Tammany teachers take longer to reach average pay than teachers everywhere else. What they do show is that teachers with the same degree and experience can have very different pay—and the districtwide averages can make those differences hard to see. State teacher pay report
How pay compares with the five largest school-tax collectors
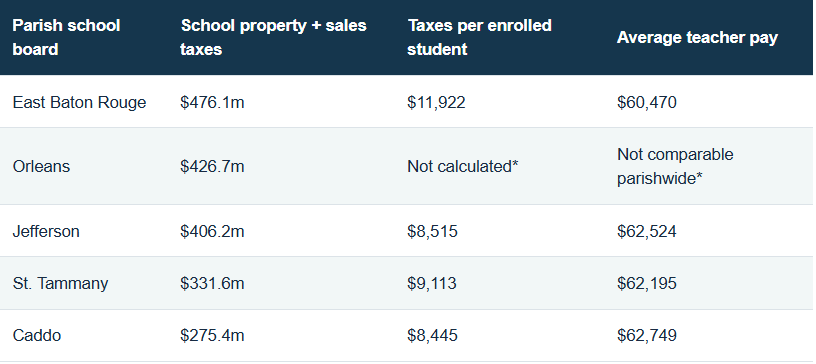
II wanted to look at school tax collections because any discussion about better pay eventually comes back to the same question: can the district afford it? St. Tammany collected more school taxes per student than Jefferson and Caddo, yet its average teacher pay was slightly lower than both.
That comparison doesn’t prove there’s money sitting around for raises. Some money is restricted to specific uses, and debt payments and other expenses affect what each district can spend. But it does explain why I’m looking at both sides of the ledger: what our schools collect and what our employees earn. Before I can judge what raises the district can afford, I want to understand how that money is being spent and where employee pay falls on the list of priorities.
2. Classroom aides: what can someone starting the job expect to earn?
Teachers are only part of the story. I also wanted to look at paraprofessionals—the classroom aides who help teachers and students throughout the school day. Their pay deserves its own comparison, because a district’s average teacher salary tells us nothing about what an aide earns.
Here, St. Tammany compares more favorably. In the starting-pay categories I checked, St. Tammany’s listed pay was higher than the selected categories in Jefferson and St. John, and close to Plaquemines’ category for aides who meet its PRAXIS testing qualification.
The details still matter. These districts don’t necessarily require the same qualifications or place employees at the same pay level. So before treating one district’s starting figure as better than another’s, I want to make clear which jobs and qualifications I’m comparing—and what someone entering that job could actually expect to earn.
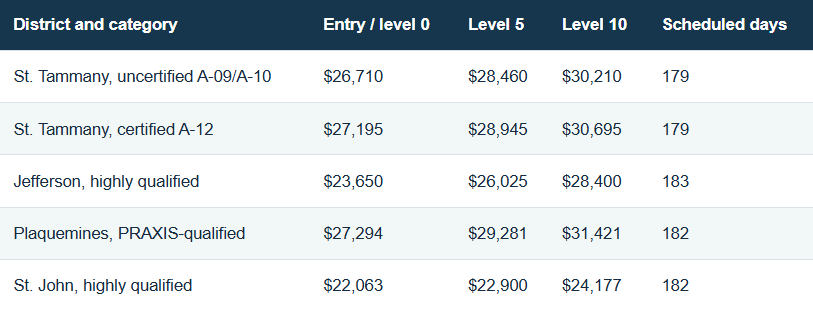
Before looking farther down the pay schedule, I want to explain what those numbered levels mean. It would be easy to read “level 10” and assume that’s what an aide earns after ten years on the job. In St. Tammany, it isn’t that simple.
For 2025–26, the district included a $1,750 increase for support workers, but employees did not receive the regular annual move to the next pay level. The schedule did provide an additional level for employees who reached certain milestones in their service with the district. Education and the rules used to place employees on the schedule also affect their level. So while I can show you the pay listed at level 10, I can’t honestly label it “what every ten-year employee earns.” St. Tammany salary policies
I also wanted to see whether a district collecting more school taxes necessarily offered a higher starting wage for classroom aides. Jefferson provides a useful example: it collected $406.2 million, compared with St. Tammany’s $331.6 million, but its published starting rate for the highly qualified aide category I checked was lower. That tells us something about the starting pay for those particular jobs. It doesn’t tell us what aides across either district earn on average, and total tax collections don’t account for differences in district size or expenses.
That brings me to the limits of this comparison. I could not verify comparable rates for regular employees in St. Bernard and St. Charles, a single comparable figure for Orleans, or statewide averages for these job categories. Without those figures, I can’t tell you that St. Tammany ranks in the state’s top five for classroom aide pay.
I also can’t rank the five largest school-tax collectors by what their aides earn on average. That would require payroll information covering comparable jobs in each district. What I can show is how St. Tammany’s published starting pay compares with the specific positions I was able to verify. That gives someone considering one of those jobs useful information, even though it falls short of a statewide ranking.
3. Bus drivers: separate wages from the cost of running the bus
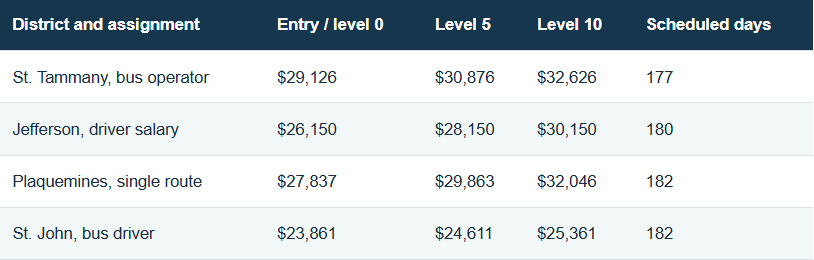
For someone considering a job driving a school bus, St. Tammany’s starting wage looks stronger in the positions I compared: $2,976 more than Jefferson’s and $5,265 more than St. John’s. But the assignment matters, too. Plaquemines lists a separate double-route category starting at $29,229. Before comparing that figure with another district’s pay, I would want to know whether the driver would be doing the same work.
I also want to distinguish money paid to the driver from money paid to cover the bus. Jefferson lists an operating allowance in addition to driver salary. St. Tammany lists separate mileage and bus-related payments. Those payments matter, but money intended to help cover the cost of owning and operating a bus isn’t the same as wages an employee can use to support a household. Adding everything together without explaining those costs could make a driving job look better-paying than it really is. Jefferson salary schedule · St. Tammany salary schedule
As with classroom aides, St. Tammany’s starting wage in this comparison was higher than Jefferson’s, even though Jefferson collected more school taxes overall. That’s another reason I don’t treat tax collections as a shortcut for judging employee pay. I need to look at the particular job and what the district pays someone to do it.
The records let me compare these starting wages, but they don’t tell me what drivers typically earn across all five of the largest school-tax collectors. I also don’t have enough comparable information to identify Louisiana’s five highest-paying parishes for drivers or say how many years it takes a driver to reach average pay. For someone weighing a job offer, the useful comparison is the wage for their assignment, the work it requires, and any bus expenses they would have to cover.
4. Other staff: cafeteria workers, custodians and school secretaries
The same questions matter for the people preparing meals, maintaining school buildings and keeping school offices running. St. Tammany can offer stronger pay for one job and fall behind in another, so I want to look at these positions individually.
I also want to look beyond the annual salary. A job that pays more over a full year may require more days of work than a job that follows the school calendar. To understand which district offers better pay for comparable work, I need to consider both what employees earn and how much time they work to earn it.
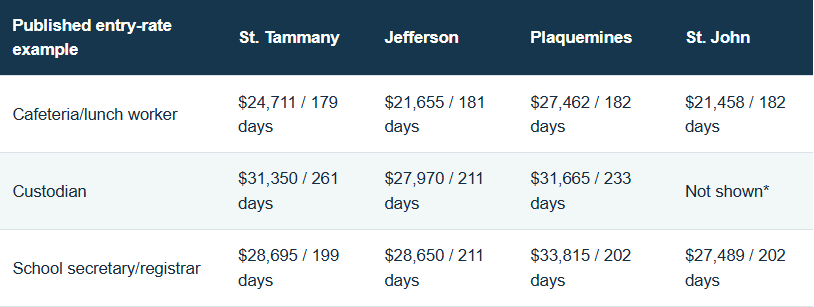
The custodian jobs offer a clear example of why I’m looking at the work calendar alongside the salary. At first glance, St. Tammany’s $31,350 looks better than Jefferson’s $27,970. But the St. Tammany position calls for 261 scheduled workdays, compared with 211 in Jefferson. That’s 50 additional days of work for $3,380 more a year.
For the eight-hour positions I compared, that works out to about $120 per scheduled day in St. Tammany and $133 in Jefferson. Someone choosing between those jobs would have two things to weigh: St. Tammany offers more income over the year, while Jefferson offers more pay for each day worked.
This is also why I can’t turn the school-tax figures into a simple ranking of which district pays better. Jefferson collected more school taxes overall, but its starting salary for the school-secretary position I checked was nearly the same as St. Tammany’s. For the custodian positions, Jefferson paid more per scheduled day. The answer changes with the job and the work calendar.
I can compare those specific positions, but I don’t have verified figures showing average pay for each occupation across all five of the largest school-tax collectors or enough information to name the five highest-paying districts statewide. And putting every support employee into one average wouldn’t solve that problem. It would mix different jobs and work hours, making it harder to see what a cafeteria worker, custodian or secretary could expect to earn.
What does the budget tell us about employee pay?
After looking at these jobs individually, I want to return to the question behind this comparison: what resources do our schools have to pay their employees?
The next table puts school-tax collections into the broader budget picture. It shows how many students each district serves, its revenue and its spending. Those figures help put the pay comparisons in context, although they don’t tell us on their own how much money is available for raises.
I’ve included the six regional school boards for which I could make a usable district comparison, along with the other two boards among the largest school-tax collectors. Dollar amounts in the last three columns are shown in millions.
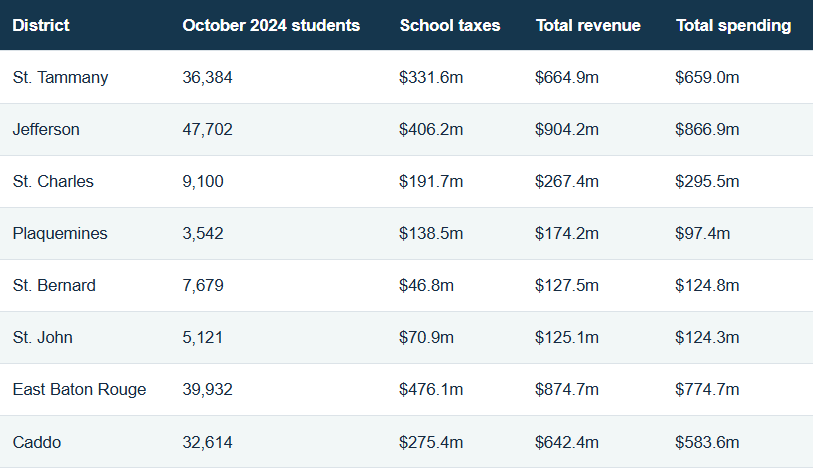
Before wrapping up, I want to explain one difference I found when checking the numbers. I compared St. Tammany’s figures in the state records with the district’s audited financial report. The school property and sales tax total matched exactly: $331,550,458. The spending figures were also nearly identical, with just a $2 difference.
When I checked the state’s financial records against St. Tammany’s audit, I found a difference that deserves an explanation. The state records show about $216.1 million in Minimum Foundation Program funding—the state’s main school-funding program—while the audit shows about $210.2 million. That’s a difference of approximately $5.9 million in the same funding category. I’d like district finance staff to explain why those figures differ and whether any of that difference affects the money available for employee pay. State financial records · District audit, printed page 20
My check also found that the calculation used for this table excluded $235,241 in property-sale proceeds, which the state lists separately from regular revenue. That means the table’s revenue total and the audit’s total aren’t directly comparable without adjustments. I’ve identified the main entries behind the difference, but I haven’t established why the state-funding figures disagree. Until that is explained, I can’t count the difference as money available for raises.
For me, this all comes back to what employees need to know. What will I earn when I start? What can I expect as I gain experience? How many days and hours will I work, and how much of the advertised pay depends on extra assignments or other conditions?
Those are the questions I want our district to answer clearly. And when we discuss raises, I want to see how we would pay for them with money the district is allowed to use for salaries and can count on year after year. A districtwide average is a starting point. Employees need to know what that number means for their own paycheck.
What should our pay goal be?
St. Tammany should aim for competitive, dependable pay that helps employees cover everyday expenses, rewards experience and makes a career in our schools financially workable. Matching the highest salary anywhere in Louisiana is not the necessary measure of success.
For teachers, a reasonable proposed target is the top third of nearby districts at entry and at five, ten and fifteen years of experience. Compare the same credentials and work calendar, and show recurring salary separately from bonuses and extra assignments. This would focus attention on the actual career path rather than a districtwide average that can hide gaps. It is a proposed policy goal—not a claim about our current rank or a dollar amount already established by this research.
For paraprofessionals, drivers, cafeteria workers, custodians and other staff, evaluate pay against ordinary local expenses: housing, utilities, food, transportation and health care. Review hourly rates, guaranteed hours and annual earnings together, recognizing that school-year and part-time jobs have different calendars. Where pay falls short, make improvements a budget priority, particularly for the lowest-paid positions. A higher advertised hourly rate means little if employees cannot count on enough paid hours.
The School Board should publish the cost of reaching these goals and a phased plan funded by verified, recurring resources. Explain when step advancement will occur and what funds support it. Employees deserve a realistic path forward, and taxpayers deserve to see how it will be paid for.
Improving pay without automatically raising taxes
Before asking taxpayers for more money, the School Board should demonstrate what it can redirect from its existing spending. That starts with a public review of staffing, contracts and operating costs. The district already publishes budgets, an online checkbook and internal audit reports that can help guide that work. The options below are recommendations for review; this comparison has not established that particular positions are unnecessary or that a specific amount of waste exists. Source: district financial records and audit reports.
Reduce staffing costs through attrition where the work allows it. When employees retire or leave, review whether each position needs to be filled, can be combined with another role, or can be reorganized. Examine central-office and administrative functions alongside school-level staffing, using enrollment, workload and service needs. The aim should be fewer unnecessary positions over time, while protecting classroom instruction, required special-education services, safe transportation and manageable employee workloads. Count only the net savings after any added overtime, contracting or reassigned work—not the full salary of a vacancy that still requires a replacement.
Re-evaluate contracts before renewing them. Review consulting, software subscriptions, insurance, equipment leases and other service agreements for price, actual use and results. Seek competitive prices where appropriate, renegotiate terms and discontinue services that duplicate work or no longer justify their cost. Any savings estimate should account for cancellation charges, transition costs and the cost of providing the service another way.
Look for avoidable operating costs and ineffective spending. Review energy use, purchasing, inventory, bus routing, overtime and programs with weak participation or results. Follow up on audit findings and publish what corrective actions actually saved. Cutting waste should mean identifying a specific expense that can be reduced without an unacceptable loss of service—not simply labeling an entire department wasteful.
Put verified, recurring savings into a transparent pay plan. Show the public which spending reductions would fund which raises, including the associated employer retirement and payroll costs. Prioritize the largest verified pay gaps and hard-to-fill positions, and make early-career pay and annual advancement part of the discussion. A one-time saving or temporary vacancy can support a one-time payment, but a permanent raise needs a sustainable source of funding. Restricted funds should not be treated as freely available for salaries.
This review should produce a public list of proposed changes, net annual savings, service impacts and dollars available for compensation. It may identify room for better pay without a tax increase. Whether those savings would cover the desired raises remains to be demonstrated.
Overall assessment
St. Tammany’s pay is competitive in some areas, but the overall average gives an incomplete picture. Its teacher average sits below the state’s highest-paying parish systems, and several nearby districts pay more to teachers at comparable early- and mid-career experience levels. The selected support-staff schedules show a more favorable picture in several categories, although qualifications, workdays and assignments affect those comparisons. Annual step advancement is also not automatic, so employees need to know both the salary schedule and how movement through it will be funded.
The case for improvement should therefore be specific: identify the jobs and career stages where St. Tammany falls behind, then connect proposed raises to reliable funding. The district’s substantial tax collections justify close scrutiny of spending, but they do not by themselves prove that every requested raise is affordable.
The goal should be stronger regional teacher pay and dependable compensation for every job—not simply a higher districtwide average. Review staffing through attrition, scrutinize contracts, eliminate documented waste and direct sustainable savings toward employees. Before proposing higher taxes, the School Board should show taxpayers what it has done to make that possible—and show employees a pay plan that rewards their work and is realistic to sustain.
How these comparisons were made
Teacher figures use LDOE’s ranked population, excluding ROTC teachers, sabbaticals, salary reductions and rehires. Experience figures are actual averages for separate groups observed during one school year; they are not salary-schedule promises or the earnings history of one employee. No employer-benefit valuation is included.
“School taxes” means reported school-board property and sales tax receipts, including associated amounts within those categories—not all parish government taxes, tax rates or household tax burden. Per-student amounts divide annual receipts by the October enrollment snapshot, not average daily attendance. Tax collections can include restricted and debt-service money. Support-staff comparisons show selected schedule classifications because comparable category averages and statewide rankings were not established.
Dont forget to like and follow my Facebook page: https://www.facebook.com/ben4sb